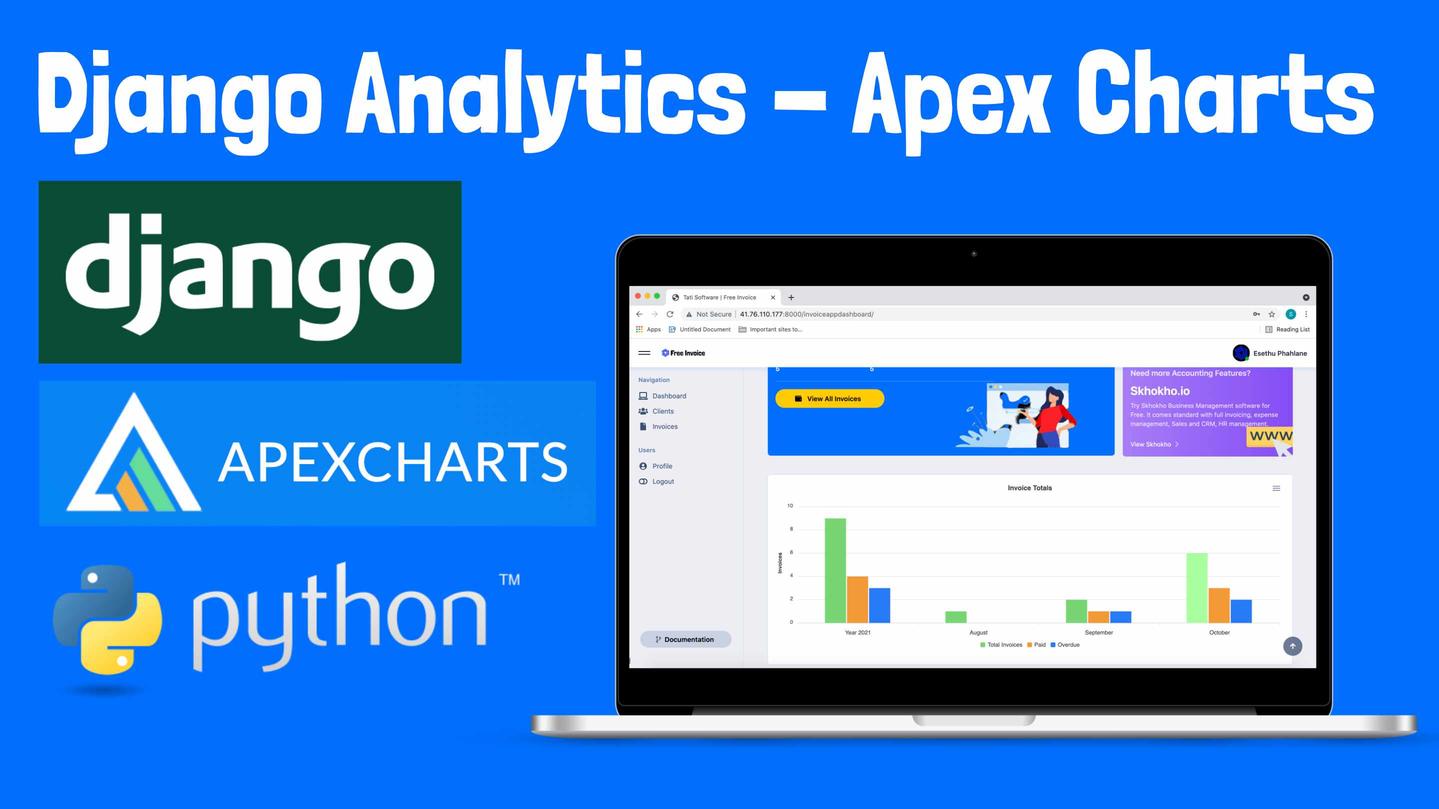
This course is designed to teach you how to create interactive and visually appealing charts in a Django application using Apexcharts JS library. With the increasing demand for data visualization, understanding how to effectively display data in the form of charts is a valuable skill for any Django developer.
Throughout this course, you will learn the fundamental concepts of data visualization, explore the features and capabilities of Apexcharts JS, and discover how to integrate it seamlessly into your Django application. You will gain hands-on experience by building real-world charting functionalities, starting from basic line charts to advanced pie charts, bar charts, and more.
By the end of this course, you will have a solid understanding of how to leverage Apexcharts JS to create dynamic and interactive charts, enhancing the user experience and making your Django application stand out.

Software Programmer and Tech Entrepreneur, i have extensive experience in Software Development - end-to-end in most platforms, Business Processes and Entrepreneurship. I am a fully qualified Engineer, with a Bachelors Degree and Masters in Business Administration - with over 17 years of professional experience. I am also an entrepreneur with a couple of award winning ventures and projects in Software Development.